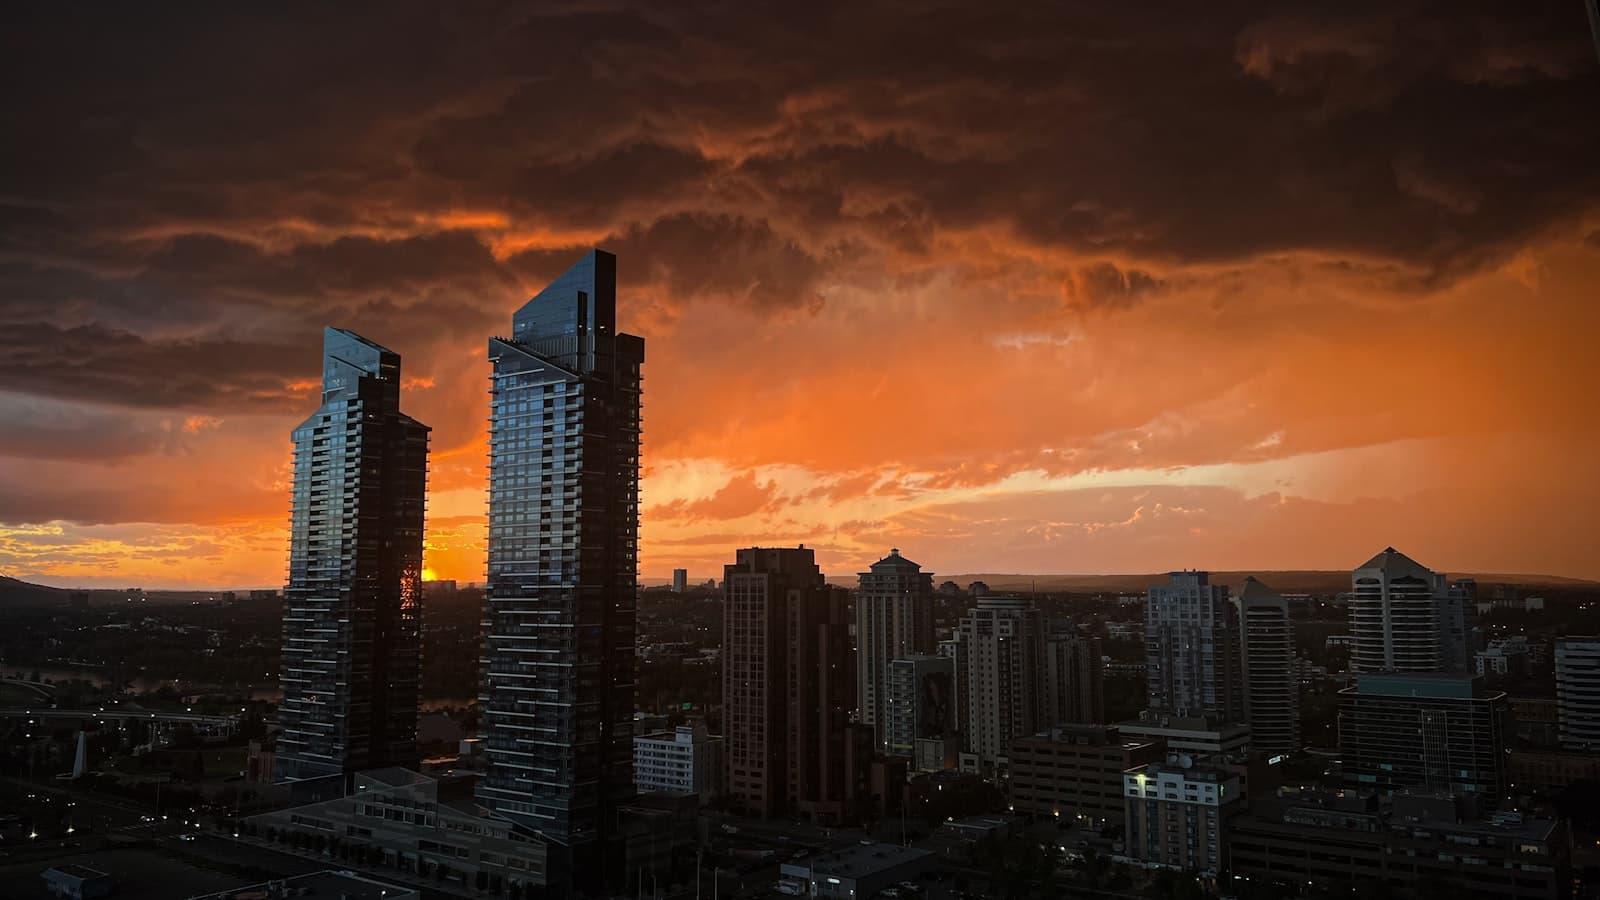
The Beltline tour asks you to read the skyline as a chart. Not a metaphor, a chart. Line up downtown Calgary's biggest towers by the year they were finished and set them against the price of crude oil, and a pattern falls out that is hard to unsee once you have seen it. The tour walks eight stops through the downtown core into the Beltline, and at each tower it asks the same question: what was the oil price doing when this was commissioned, and what was it doing when the doors opened?
The lagging-indicator logic
A skyscraper takes years to plan, finance, and build. In a city whose economy runs on oil and gas, the confidence to green-light a signature tower peaks when the crude price peaks, because that is when the money and the optimism are highest. But construction outlasts the boom. By the time the building is delivered, the cycle has usually turned, and the tower opens into a softer market than the one that inspired it.
The result is that Calgary's tallest buildings are not really monuments to booms at all. They are monuments to the busts that caught up with them. Each one is a decision made at the top of a cycle, made physical just as the cycle bottoms out. The skyline is a lagging indicator drawn in glass and steel.
The towers on the walk
Hear a stop from this walk
Suncor Energy Centre (formerly Petro-Canada Centre)
The Bow is the anchor of the reading. The 236-metre crescent by Foster + Partners was conceived in the mid-2000s boom and completed in 2012, and it topped out as the tallest building in Calgary. Its curved plan turns toward the sun, but its timing tells the older story: a boom-era commission delivered into a very different market.
Around it the tour reads Suncor Energy Centre, Bankers Hall, Brookfield Place East, and Eighth Avenue Place, each an energy-sector headquarters, each slotting into the same cycle at a different point. Then the walk crosses the old CPR line into the Beltline and out to 17th Avenue, the strip that fills with red on Flames playoff nights and earned the nickname the Red Mile. The contrast is the point: the corporate towers of the boom on one side of the tracks, the street life that outlasts every cycle on the other.
The plaza sculpture worth the detour
Near The Bow stands Wonderland, the twelve-metre wire-mesh head by Jaume Plensa unveiled in 2013. It is worth pausing on not just because it photographs well but because a boom-era plaza sculpture is itself an artifact of the cycle: the kind of public gesture a company commissions when the balance sheet is full.
Where this sits in the Calgary story
Reading the skyline as an oil chart is one chapter of a bigger argument about how Calgary keeps rebuilding itself on the boom. The winter chapter of that story is the +15 skywalk network, which moved the downtown up a level. The full narrative angle is in Calgary: the city the oil price built and rebuilt.
The tour runs about 83 minutes over 3.9 km with eight stops, and it is free to start: the introduction and first stop play in full, and every later stop plays a short preview. Compare it against Calgary's other routes in the best self-guided walking tours in Calgary or the architecture walking tours guide.
Ready to experience it?
Downtown and the Beltline: The Balance Sheet Skyline
83 min · 3.9 km · easy
More from Calgary
Explore more at your own pace.
Calgary: The City the Oil Price Built and Rebuilt
Inglewood and the Confluence: Two Sides of One River, Two Kinds of Memory

The +15: How Calgary Built a Second City Fifteen Feet Up
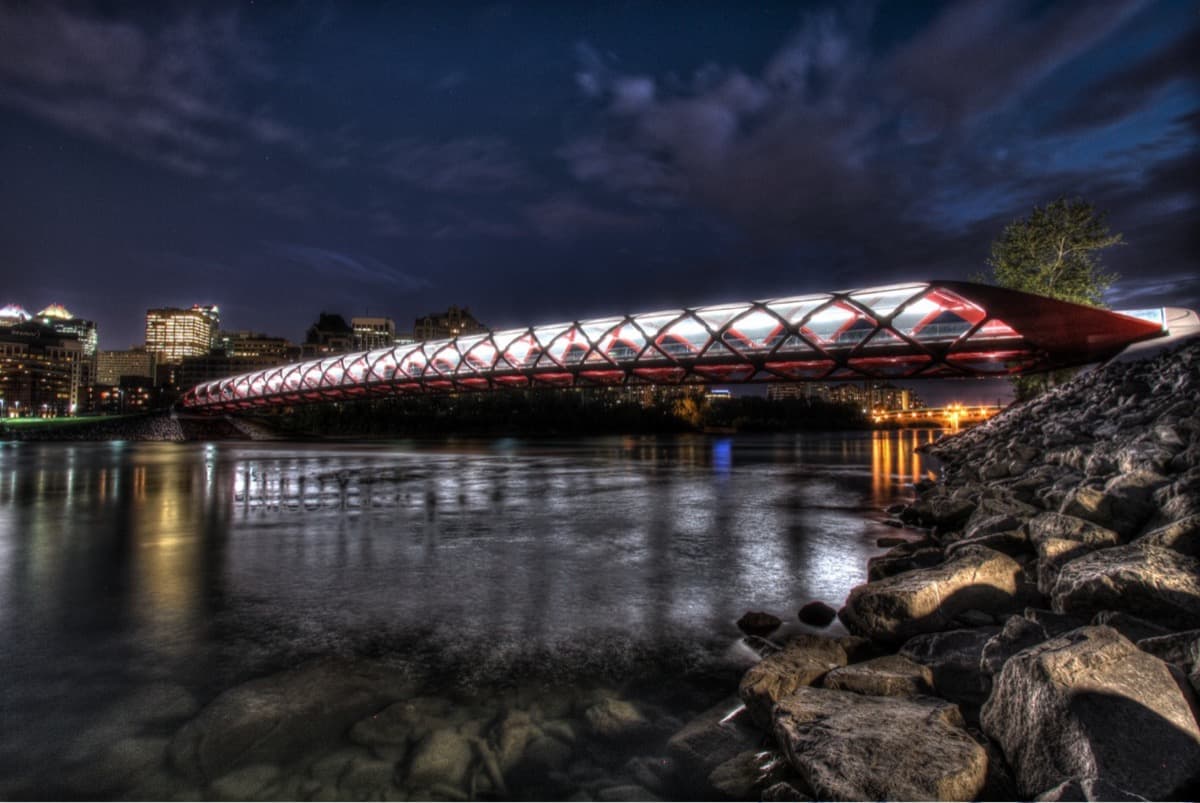
The Bridge Calgary Argued About: Crossing Between Two Calgarys
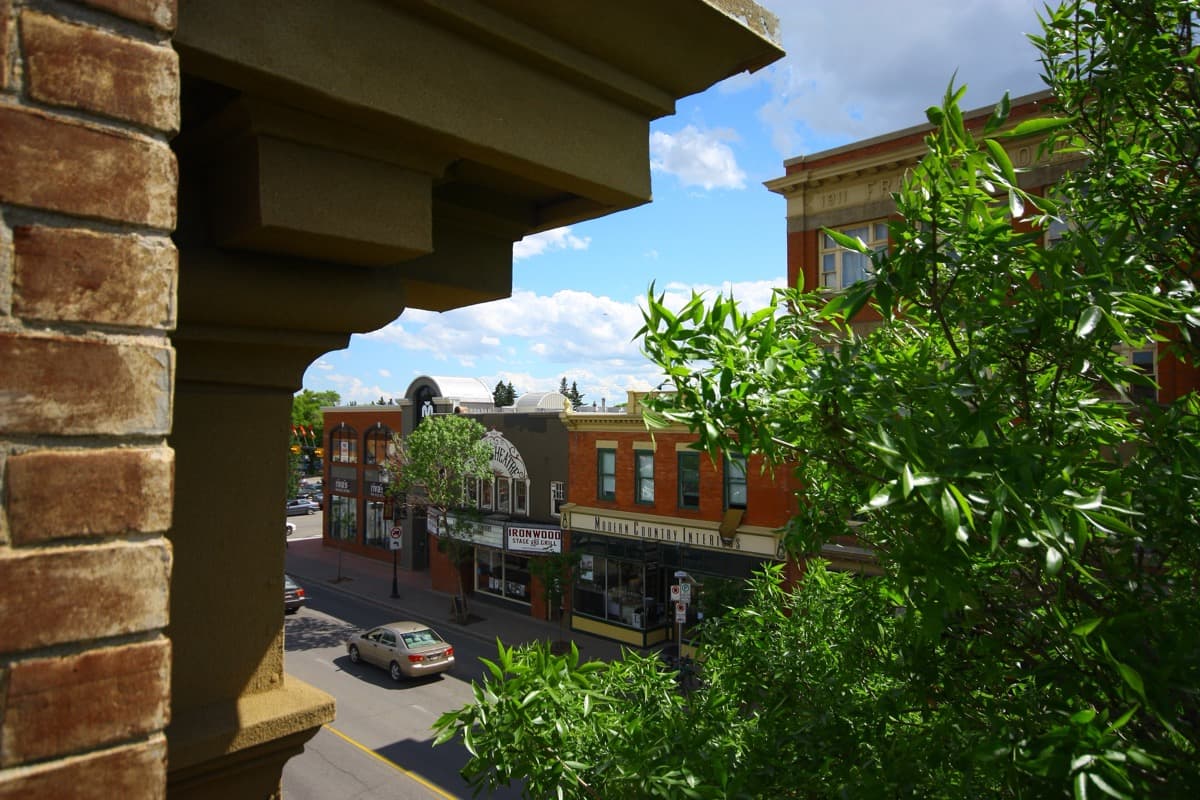
Inglewood: Calgary's Oldest Neighbourhood Turned Maker District